Home Page | My Works | Seminar | BURP Thesis
Paper on
Land Cover Mapping of Khulna City Applying Remote Sensing Technique
MD. MASUM BILLAH
URBAN AND RURAL PLANNING DISCIPLINE
SCHOOL OF SCIENCE, ENGINEERING AND TECHNOLOGY
KHULNA UNIVERSITY, KHULNA
BANGLADESH
September, 2001
Land Cover Mapping of Khulna City Applying Remote Sensing Technique
Md. Masum Billah
Student No. 970419
Urban and Rural Planning Discipline
School of Science, Engineering and Technology
Khulna University, Khulna, Bangladesh
Email:
Masum_jewel@yahoo.com
Ph: +880-17-1934726 (Mobile)
Abstract
Information
on land use and land cover is required in many aspects of land use planning
and policy development, as a prerequisite for monitoring and modeling land use
and environmental change, and as a basis for land use statistics at all
levels. Remote sensing can provide frequent land cover of an area which can be
a great tool to monitor urban land use pattern and change for physical
planning of an urban area. As a metropolitan city Khulna has a distinctive
land cover/land use pattern. Analyzing space born satellite image of the city
this distinctive land cover has been explored very efficiently. According to
the land cover map the largest land cover of Khulna city is vegetation.
Buildup area is the second major land cover of the city.
Background
Remote Sensing is the science and technology by which the characteristics of objects of interest can be identified, measured or analyzed without direct contact. The characteristics of an object can be determined using reflected or emitted electro-magnetic radiation from the object. That is, each object has unique and different characteristics of reflection or emission if the type of object or the environmental condition is different. Remote sensing is a technology to identify and understand the object or the environmental condition through the uniqueness of the reflection or emission.
For decades the U.S. and the former Soviet Union have used high-resolution satellite imagery for military purposes. Only recently, however, has the civilian community in the U.S. been given permission to launch satellites that can resolve objects on the ground as little as a meter apart. Existing civilian satellites can obtain a 1m ground resolution. Data from those satellites already have had an enormous impact on mapping which allows the creation of specialized maps that can be used to monitor land use change, digital mapping, flood forecasting, disaster damage calculation, forest management, drainage network design etc. High resolution image along with GPS-controlled satellite positioning makes digital mapmaking and data collection easy and accurate.
The use of satellite image is very popular world wide but in Bangladesh its application is very limited. Remote sensing technology already has been proved as a time saving and economic technology than any other method of special purpose map preparation and also for collecting data about an area. To a planner an important and basic tool is data related to land space as an expert of optimum land user. Remote sensing can provide many required data in short time with a reasonable accuracy. Planer may use this data to monitor urban growth pattern, urban sprawl, land management, urban structural change, find out potential land for development and redevelopment.
Everything on earth is changing with time. To observe the change and also the current situation land cover map can be a powerful tool. With manual survey it is impossible to cover a large area in short time but with remote sensing (land cover map) it is very easier task.
Khulna is a divisional head quarter and a metropolitan city but all the area of the city is not yet built up. It still contains paddy land, homestead with orchard and kitchen garden etc. With land cover map it can be revealed how mach area of this city is using for what purpose.
Objectives
v To identify the possible application and prospect of remote sensing in urban planning
v To produce land cover map of Khulna City Corporation area using satellite image with the help of remote sensing technique
Application and Prospect of Remote Sensing in Planning
Planners have traditionally relied on field surveys and censuses for the data required to carry out their planning tasks. Planners commonly complain that the urban databases developed by traditional methods show incomplete spatial coverage, are poorly organized and based on incompatible criteria (Coiner and Levine 1979). For some time now, planners have relied on remote sensing for urban land use and land cover data to overcome some of these problems (Jensen 1983, Ford 1979).
The results of many studies in North America and West Europe demonstrate that high resolution satellite data such as SPOT-HRV and Landsat-TM are very useful for gathering land use and land cover information (Jadkowski and Ehlers 1989, Ehlers et al. 1990), land use change detection (Martin 1986) and urban growth analysis (Kam et al. 1994). These encouraging results have attracted the attention and interest of developing countries (Kam, 1994).
Application in Urban Land Use Mapping
In developing countries satellite remote sensing was initially used for surveying, identifying, classifying, mapping and monitoring natural resources, environment and disaster. More recently, planners and researchers in developing countries have investigated the ability of satellite data to provide timely and up-to-date information on the urban environment, especially for urban land use mapping (Gastellu-Etchegorry 1988, UNESCAP/UNDP 1985, UNESCAP/UNDP 1987).
A study in Indonesia used digital SPOT-XS data to create an up-to-date land use map for Yogyakarta and its surroundings (Gastellu-Etchegorry, 1988). The study showed that simple spectral classification of SPOT data was faster, more convenient and resulted in better cartographic documents.
Application in Monitoring Urban Growth
Mahavir and Galema (1991) used SPOT data to monitor the growth pattern of Chiangmai, Thailand. They visually interpreted panchromatic print of a SPOT image of 1:20000 scale. They reported that they achieved an overall accuracy of 92.7 percent in the interpretation of the SPOT image. The study concluded that SPOT data are a useful data source for quick and overall assessments of urban growth trends, both quantitatively and qualitatively (Kam, 1994).
Dimyati and Kitamura (1992) used multistage and multidata satellite data to analyse the growth of Samarinda, Indonesia. This study employed digital image analysis techniques to classify 1984 Landsat MSS data and 1987 SPOT-HRV data separately. Its resulting images were overlayed to reveal the residential growth process of the study area from 1984 to 1987.
Application in Monitoring Urban Sprawl
Satellite data can also be used to monitor areas experiencing rapid urban sprawl. In Barranquilla, Colombia, (Brouwer et al. 1990) compared SPOT satellite imagery taken in May 1986 with a 1982 city map of Barranquilla to highlight land use changes detection. The result of the study helped planner receive their computer database quickly and to direct their resources to where major changes had occurred. The satellite data facilitated a quick and accurate urban growth assessment to be carried out, not by a computer or remote sensing expert, but by a town planner having only a modest knowledge of remote sensing (Kam, 1994).
The applications discussed above show how urban planning and management can be benefited using satellite images. Still, most of the applications of satellite data made by urban planning agencies in developing countries are experimental (Kam, 1994).
In Bangladesh this technique can be used for urban land use monitoring and forecasting future land use. Traffic management and planning in an already developed city like Dhaka is very much difficult. In this case high resolution satellite image can help to select necessary measure. Encroachment of open space in urban area can be identified applying remote sensing. To find out rain water or flood water stagnation in urban area for taking necessary measures remote sensing can be used very efficiently. Suitable land space for future urban growth can be found out using satellite image and planner can guide urban growth thereby for sound urban development. For linear utility service network layout design the suitable way and barriers can be assessed through remote sensing technique. In fact there are many other prospects of remote sensing in urban planning which have to be explored through research.
Present Situation of Bangladesh
Emergence of Geographic Information System (GIS) and Remote Sensing (RS) technology as an efficient tool for detailed survey, mapping, modeling, monitoring and analysis especially in countries like Bangladesh has paramount importance. In recent days in Bangladesh GIS and RS technology has been applied in diverse sectors in a limited scale but without a long term planning and management strategy. It is currently applied in both public (governmental) and private sectors, at NGO's, research organization and universities. In public sector application of these tools are mainly centered on agencies, which are being supported by foreign funding. At present GIS and RS application are limited in the field of water resources management, agriculture, forestry, infrastructural planning and education in Bangladesh (Nasreen, August 1999).
A number of factors affected the successful implementation of this technology; they are attributed as skilled manpower, managerial aspect, accessibility of RS data and topographical maps and lack of coordination among the users. Poor technical supports from the vendors/suppliers are identified as one of the majors constrains for the operationalization of the Geoinformatics technology in Bangladesh. Apart from these, progress in acquiring and applications of GIS/RS technology is hampered due to lack of sufficient financial and technical support from the Government on time. Lack of digital data format, standard and archiving procedures is one of the threats in the lifetime existence of the GIS/RS databases (Nasreen, August 1999).
It can be concluded from the present status of the geoinformatics technology is that, there is an urgent need for long term planning and management strategy in order to make an appropriate use of this technology for the sustainable development of the country. Awareness among the policy/decision makers, different professional and academicians need to be increase for the existence and sustainable use of this technology in the present and future.
Study Area
Khulna city is located on the banks of the rivers Rupsha and Bhairab. Geographically, Khulna lies at 22049´-north latitude and 89034´ east longitudes. And its main elevation is 7 feet above Mean Sea Level (MSL). Khulna is bounded by Bhairab River and Fultala Thana on the north, by the Rupsha River on the east, by the Rupsha River on the south and on the west by Dumuria Thana. Map 1 shows study area location.
Khulna City has not yet grown enough as a divisional head quarter and a metropolitan city. But in the last few years its growth rate is noticeable. Land cover map of different time can help the planner to understand the growth pattern and predict land use change.
Working Procedure to Get the Land Cover Map
Though the use of the terms land use and land cover is often confusing, the distinction between these two terms is fundamental. They are defined as follow (Sims, 1995; De Bie, 1995):
Land cover is the observed physical cover, as seen from the ground or through remote sensing, including the vegetation (natural or planted) and human constructions (buildings, roads, etc.) which cover the earth's surface. Water, ice, bare rock or sand surfaces count as land cover.
Land use is based upon function, the purpose for which the land is being used. Thus, a land use can be defined as a series of activities undertaken to produce one or more goods or services. A given land use may take place on one, or more than one piece of land, and several land uses may occur on the same piece of land.
In this study a land cover map of Khulna city has been prepared. The satellite image has been classified in five land cover class. The classes were:
1. Vegetation
2. Buildup
Area
3. River/Deep
Water
4. Shallow
Water
5. Open
Ground
Used Data/Satellite Image
LANDSAT TM image has been used for this study. The properties of the image were:
Image Sensor:
LANDSAT TM
Image Format: Bil
Number of Lines:
2185
Number of Pixels per Line: 1441
Spatial Resolution: Band 1-5, 7
30m x 30m and band 6 120mX120m
Spectral Resolution: 7 BANDS
(1,2,3,4,5,6,7)
Date: April, 1992
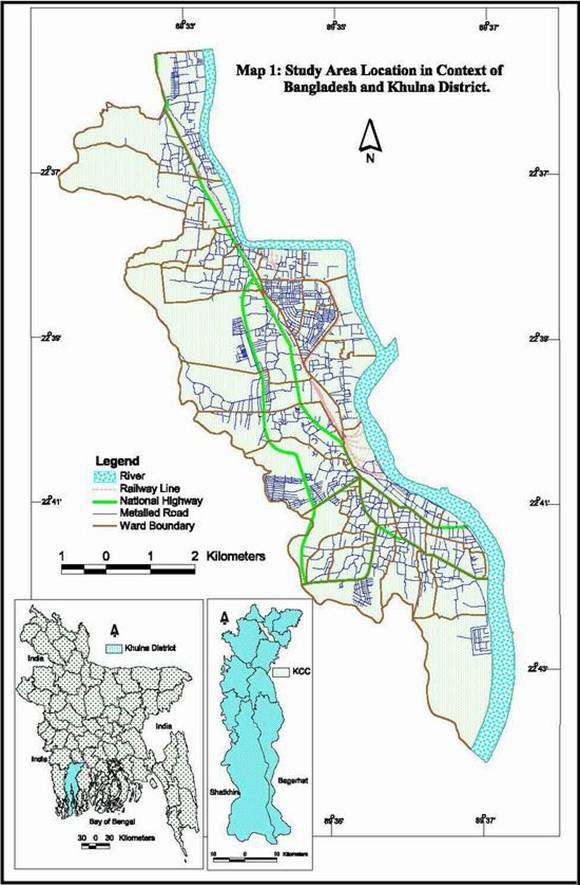
Table 1: Wavelength and application of LANDSAT TM bands
|
Bands |
Wavelength ( mm) |
Application |
|
1 |
0.45-0.52 |
Coastal water mapping, soil vegetation differentiation, deciduous, coniferous differentiation |
|
2 |
0.52- 0.60 |
Green reflectance by healthy vegetation, excellent for pollution studies. |
|
3 |
0.63-0.69 |
Chlorophyll absorption for plant species differentiation identifies contrast between the vegetation classes. |
|
4 |
0.76-0.90 |
High reflectance for the vegetation, urban areas less reflective than the vegetation. Soil-crop and land-water contrasts are emphasized. |
|
5 |
1.55-1.75 |
Important for the crop identification, crop water content and soil moisture content. |
|
6 |
10.4-12.5 |
Hydro thermal mapping |
|
7 |
2.08-2.35 |
Plant heat stress |
Image Registration and Rectification
Image Registration can be defined as the technique for transforming the image co-ordinate to the real word co-ordinate. In this study image registration has been performed with Geocoding Wizard in ER Mapper 6. For registration, rectification and image classification the source image has been converted from ERDAS Lan format to ER Mapper Ers format. The parameters of geocoding were –
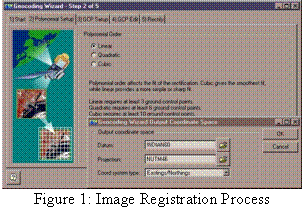 Geocoding
type: Polynomial
Geocoding
type: Polynomial
Polynomial
order: linear
GCP
picking method: A pre registered image of the area.
Output coordinate space
Datum:
INDIAN60Projection: NUTM46
Coordinate
type: Eastings/Northings
Rectification
Lines: 740
Cells: 530
Cell
dimension: 30X30
Null cell
value: 0
Image Enhancement
Image enhancement makes image cells prominent to understand image features on display device. This procedure makes it easy to identify and select ROIs (Region Of Interest). In this study linear stretching and filter operations have been performed.
Bands Selection for Display
Source image (LANDSAT TM) contain 7 bands For the display purposes it needs to select maximum 3 bands (in blue, green and red order) which would be helpful for the selection of the training areas. In this study R: 7 G: 4 B: 3 are found suitable.
Image Classification
Image Classification has formed an important part of the fields of Remote Sensing, Image Analysis and Pattern Recognition. In some instances, the classification itself may form the object of the analysis. Digital Image Classification is the process of sorting all the pixels in an image into a finite number of individual classes. The classification process is based on following assumptions (http://www.gisdevelopment.net):
| Patterns of their DN, usually in multichannel data (Spectral Classification). | |
| Spatial relationship with neighboring pixels | |
| Relationships between the data acquired on different dates. |
Major two types of classification are:
|
Supervised and | |
|
Unsupervised. |
Supervised classification
Supervised classification can be defined as the process of using samples of known identity to classify pixels of unknown identity. Those unclassified pixels are assigned to one of the several informational classes. Samples of known identity are those pixels located within training areas (Campbell, 1987).
Unsupervised Classification
This system of classification does not utilize training data as the basis of classification. This classifier involves algorithms that examine the unknown pixels in the image and aggregate them into a number of classes based on the natural groupings or cluster present in the image. The classes that result from this type of classification are spectral classes. Unsupervised classification is the identification, labeling and mapping of these natural classes. This method is usually used when there is less information about the data before classification.
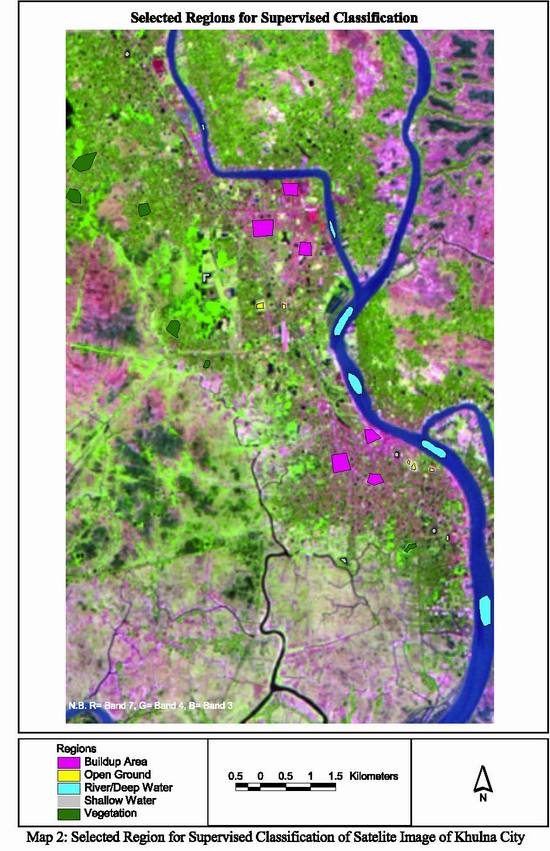
Supervised classification has been used to classify the image of Khulna City as the area is known enough to select training area. Supervised classification involves the following stages:
Training Stage
The analyst identifies the training area and develops a numerical description of the spectral attributes of the class or land cover type. During the training stage the location, size, shape and orientation of each pixel type for each class has been analysed to categories according to land cover class. (http://www.gisdevelopment.net)
Some regions have been selected from Khulna City area for five land cover class through training process. The location is presented in Map 2. The features of the regions are described in Table 2.
Table 2: Features of selected region for classification
|
|
Open land |
Buildup Area |
Vegetation |
Stagnant/ shallow water |
River/ deep water |
|
No. of region |
5 |
6 |
6 |
6 |
7 |
|
Total cells |
34 |
590 |
374 |
18 |
515 |
|
Area in acres |
3.06 |
131.21 |
33.66 |
1.62 |
46.35 |
|
Area in hectares |
7.56 |
53.11 |
83.18 |
4.00 |
114.53 |
Classification Stage
Each pixel is categorised into land cover class to which it closely resembles. If the pixel is not similar to the training data, then it is labeled as unknown. Numerical mathematical approaches to the spectral pattern recognition have been classified into various categories.
Supervised classification of ER Mapper has been used for image classification. Among all the methods of supervised classification available in ER Mapper the result of Minimum distance classification matches best with land cover of Khulna City. So, Minimum distance classification has been used for land cover classification.
Output
Classified image has been exported from ER Mapper image format to BIL format to make it computable with ArcView.
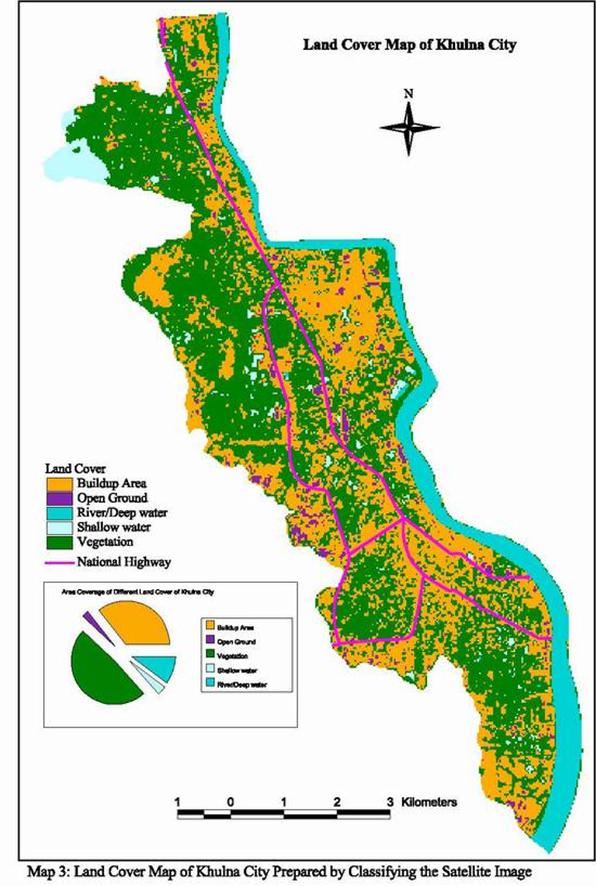
Land Cover Analysis
The classified image has been converted to GRID format for spatial analysis in Spatial Analyst of ArcView. Khulna City area has been separated from the GRID applying an Avenue Script. Map 3 present the result. Finally, the total area of each land cover has been calculated from total GRID cell number of each land cover. The result is presented in Table 3. Among 12537.3552 acres area of Khulna City 6091.546 acre is vegetation coverage. The second land coverage is buildup area which contains 4466.2368 acre area. The other area coverages are river/deep water 1281.9136 acre, shallow water 402.7664 acre and 294.9024 acre in open ground.
Table 3: Land area in different land cover in Khulna City
|
Land Cover |
No. of Cells |
Area in Acres |
Area in Hectares |
Percent |
|
Vegetation |
27390 |
6091.536 |
2465.10 |
48.59 |
|
Buildup Area |
20082 |
4466.2368 |
1807.38 |
35.62 |
|
River/Deep Water |
5764 |
1281.9136 |
518.76 |
10.23 |
|
Shallow Water |
1811 |
402.7664 |
162.99 |
3.21 |
|
Open Ground |
1326 |
294.9024 |
119.34 |
2.35 |
|
Total |
56373 |
12537.3552 |
5073.57 |
100 |
Though Khulna became Metropolitan City at 1984 at 1992 it contains 48.59 percent green land and only 35.62 percent buildup area. The buildup area is mainly concentrated in two clusters. The first cluster is around Khalishpur area and another cluster is around (Central Business District) CBD area. Also a linear growth pattern along Rupsha and Bhairab River is prominent in the growth pattern of Khulna City.
Limitations
Availability of satellite image was the major limitation of this study. This study has been conducted on only one image dated April, 1992. In fact from image of 30m resolution it is difficult to explore urban feature efficiently. Some homestead containing garden and trees, cannot be separated in some case due to resolution of the image. Also small structures with vegetation cannot be separated efficiently due to same cause.
Conclusion
Space borne satellite image can provide up to date information about an area. This information can be an important tool for the planners. In fact in context of Bangladesh remote sensing technology is an unexplored field. By using this rarely used tool land cover map of Khulna City has been prepared in this study with reasonable accuracy. So this technology can be used to other cities of Bangladesh to monitor urban growth pattern. At last it can rationally be said that in Bangladesh remote sensing has a great prospect in planning field.
Reference
Antonio D.G., 1996, FAO Land Cover Classification: A Dichotomous, Modular-Hierarchical Approach, Food and Agriculture Organization of United Nation (FAO) http://www.fao.org/waicent/faoinfo/agricult/agl/agls/fgdcfao.htm
Brouwer, H., Valenzuela, C.R., Valencia, L.M. and Sijmons, K., 1990, Rapid Assessment of Urban Growth Using GIS-RS Techniques, ITC Journal, No. 5 pp 233-235.
Campbell, J.B., 1987, Introduction to Remote sensing, The Guilford Press, New York.
Coiner, J.C. and Levine, A.L., 1979, Application of Remote Sensing to Urban Problems, Urban Systems, Vol. 4, pp 572-582.
Dimyati, M. and Kitamura, T., 1990, The Application of Digital Image Processing for Residential Variation Analysis Using Landsat MSS and SPOT HRV Data, Asia-Pacific Remote Sensing Journal, Vol. 2, No. 2 pp 33-41.
Ehlers, M., Jadkowski, M.A., Howard, R.R. and Brostuen, D.E., 1990, Application of SPOT Data for Regional Growth Analysis and Local Planning, Phogrammrtric Engineering and Remote Sensing, Vol. 56 No. 2, pp. 175-180.
Ford, K. (ed), 1979, Remote Sensing for Planners, Center for Urban Policy Research, Rutgers.
Gastellu-Etchegorry, J.P., 1988, Remote Sensing with SPOT: An Assessment of SPOT Capability in Indonesia, Gadjah Mada University Press, Yogyakarta.
Jadkowski, M.A. and Ehlers, M., 1989, GIS Analysis for SPOT Image Data in Technical Papers: GIS/LIS 1989 ASPRS/ACSM Annual Convention, Baltimore. Vol. 4, pp 65-74.
Jensen, J.R., 1983, Urban/Suburban Land Use Analysis, Manual of Remote Sensing, 2nd Edition, Vol. II, American Society of Photogrammetry, Virginia.
Kam, T.S. 1994, Application of Remote Sensing and Geographical Information Systems for Urban Planning in Developing Countries: Potentials and Pitfalls, UNCRD Research Report Series No. 5, pp 11-20.
Mahavir and Galema, M., 1991, Monitoring Urban Growth Using SPOT Images and Aerial Photographs, ITC Journal, No. 2 pp 63-69.
Martin, L.R.G., 1986, Change Detection in the Urban Fringe Employing Landsat Satellite Imagery, Plan Canada, Vol. 26, No. 7, pp 182-190.
Nasreen, I.K., 1999, Present Status of Geoinformatics Technology in Bangladesh: Special Emphasize on Implementation and Operationalization, 2nd International Symposium on Operationalization of Remote Sensing, ITC.
Nations Development Programme (UNESCAP/UNDP), 1987, Remote Sensing for Urban Survey and Human Settlement Analysis, Bangkok.
United Nations Economic and Social Commission for Asia and the Pacific/United Nations Development Programme (UNESCAP/UNDP) (ed), 1985, Development and Applications of Remote Sensing for Planning, Management and Decision Making, Bangkok.
Sims, D., 1995, Background Note on Ongoing Activities Relating to Land Use and Land Cover Classification, FAO, Internal Document, Rome. pp 7.