Home Page | My Works | Seminar | BURP Thesis | Contents
CHAPTER NINE
DEVELOPMENT OF GUIDELINES AND MATRIX
In implementing and using a Geographical Information System (GIS), the user makes a number of important decisions. The decision to use vector or raster data models, or both, to encode geographical data is critical. The two data models have specific advantages and disadvantages but the decision can not be made on these alone. In essence the choice of data model will depend upon the intended users, the data, the system or systems and, most importantly, upon the application. Traditionally GIS data conversion technology was not available or not accurate enough for practical purpose so a user was bound to use the data model in which the source data is available. Also integration of data model is not possible in many cases. However, recently the integration among the data models and the algorithms used to rasterise or vectorise GIS data improved at a satisfactory level. So now GIS users can use both the data models simultaneously.
9.2 Advantages and disadvantages of Data Models
The strength of the raster data model is its simplicity. Many operations on geographic data are easier to implement and execute faster in a raster GIS. Modeling of continuous data , as is often done with elevation or hydrological data, is usually performed with a raster GIS. One disadvantage is that there is a trade-off between the size of the resulting raster data sets and the precision with which spatial features can be represented. A very fine raster grid will represent all curves in a boundary with sufficient detail, but will require a large amount of disk space.
Most standard GIS operations some how can be performed on both data models. But the accuracy or quality of output will must not be equal. So, which data model will produce good result will depend on some parameter. Certainly data model will be one of them as every data model have its specialty and advantage-disadvantage.
Table 9.1: Advantage and Disadvantage of Vector and Raster Data Model
|
Vectors |
Advantages |
Disadvantages |
|
· Topology can be described explicitly - good for network analysis · Accurate graphic representation at all levels · Retrieval, updating and generalisation of graphics and attributes are possible · Vector Precision can be encoded with any conceivable degree of precision · Use less mass storage than a raster based system of high enough resolution to emulate the vectors |
· Complex data structure · Display and plotting time are consuming · Assume hard-edged boundary model of the world · Vector topology is complex · Calculation of distances may be complex · Number of concurrent on networks users may be limited |
|
|
Rasters |
· Simple data structure · Simple of organization of database. · Raster data can be processed very quickly · Mathematical modeling is easy · Technology is cheap · Useful for proximity analyses · Rasters are handled naturally in computers because programming languages support array handling and operations. |
· Large data volumes · Using large grid cells to reduce data volumes reduces spatial resolution, results in the loss of information · Co-ordinate transformations difficult and time consuming · Limitations in measuring linear features. · A point object must occupy a full cell in raster, this creates some problems |
(Adapted from Burrough 1986; 1998; Star 1990; Parson 1997; Gahegan et al 1988)
Consequently the importance of the choice between data mode is declining with the development of accuracy of data conversion techniques between data models. But it still remains the principle decision of a GIS application.
Figure 9.1: Raster vs. Vector Data Model
Raster is Mozart building a theme of the music into a glorious structure, even though it may seem to have too many notes. Beethoven is Vector with bold, leaping strikes, going from place to place with rapid efficiency (Parson 1997). In the same way that these musicians have distinctive styles so raster and vector models have distinctive uses. The observation units of vectors are "end points" and/ or variable line or polygon magnitudes. The emphasis is on the relationship and distribution of geographic features. Furthermore vector models are most appropriate for real-world observations and phenomena are generally related to specific locations; point-measurements, lines and boundaries. Raster models are fixed observations on a grid with the emphasis on the variation of a geographic feature over an area. Raster models are best suited to show geographic variation of phenomena, while a vector model is best suited to documentation of these phenomena.
It is important for the users of GIS, to consider the limitations and advantages of each model for two reasons. Firstly, time management will be more efficient when selecting the appropriate data model that will meet the users’ requirements. Secondly the analysis or output from the GIS will be of greater value to the users; essentially there is an opportunity cost involved.
Commentators have identified four areas that the user must consider in choosing between the data models: co-ordinate precision, speed of analytical processing, mass storage requirements and the characterisation of phenomenon. (Van der Laan 1992; Piwowar et. al 1990) The user will also have to consider issues associated with the source of the data.
Raster precision is limited by the size of cells. Locational precision is limited to the distance from a cell's centroid to one of its corners. Vector data can be encoded with any desired degree of precision, limited only by the number of bits for the number representation. (A GIS analyst should be familiar with the ways in which numbers are represented in the system that he/she is using.) However, one must be careful to distinguish between the apparent precision (determined by the number of bits) and the actual precision of the data (as measured).
Raster data can be processed very quickly to answer questions involving overlays, proximity, and boolean queries. No calculations are required to determine relative positions between layers. In most cases, analysis requires cell-by-cell comparison of the contents of layers, and little arithmetic computation is required beyond simple conditional statements. The simplicity of raster operations made the raster model very popular for resource management systems that were run on small computers as large cell can reduce the complexity and increase speed.
The simplest raster data storage method requires one byte per cell. File compression is possible through a variety of approaches. Most common are forms of run length encoding, so that the degree of compression achievable depends on the spatial variability of data.
Vector data require very little storage for simple polygons, but memory requirements will depend on complexity of objects and the relationships between objects which are to be stored in the database. Generally, a vector model will use much less storage than a raster-based model of a resolution high enough to emulate the vectors structure.
Finally, technological change affects speed and storage specifications. A widely accepted rule-of-thumb suggests that one gets around 10 times as much "computer power" (speed and space?) per dollar spent, over every 3 or 4 years (John, 2001). In what ways might this improvement influence a choice between the vector and raster data models?
The type of data, and the operations to be performed, may determine the choice of data model. For example, a raster gives a regularly spaced sampling of phenomena that does not allow for differences in the rate of change of spatial phenomena. The largest source of raster data is from remote sensing, where the satellite does not vary its sampling in response to variation on the earth's surface (though one can of course edit the raw data).
If it is known where greater variation occurred, it could be possible to sample these areas more finely, and avoid wasting samples in areas of little variation. A vector representation could specify more spatial variability in some areas than in others. But consider the case of a land classification problem in which large areas clearly of one class are represented by polygons. The change from one class to another is unlikely to be abrupt, and boundary regions might be better represented in raster format.
Expression of fuzzy boundaries in (say) land classification probably also needs a raster model. Some approaches to land classification assign, to each pixel in a satellite image, a probability value for each class. If there are n classes, it might then have n cells, one for each class, and show in each cell the probability that the area corresponding to that cell is a member of the class to which that raster applies. (The implications for storage requirements are considerable!)
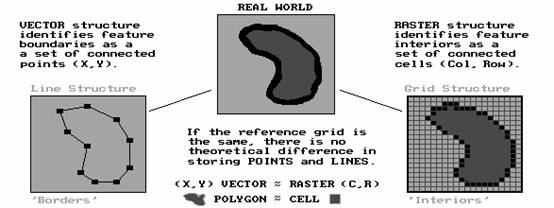
Figure 9.2: Raster vs. Vector Structure
On the other hand, with raster data, it is difficult to group cells together as an object with attributes, for example to connect cells along a road or to aggregate cells as a forest stand. Such data organizations are very natural in a vector representation and operations on objects (such as choosing vehicle routes through a road network) are far easier. But it became clear that there were limitations especially in measuring linear features. Vector data was therefore used for the analysis of linear features because the data depicted the homogenous areas as polygons delimited by curvilinear boundaries.
For census and many other socioeconomic applications, the vector model is more appropriate. Vector data structures allow a more compact representation of points and polygons which define socioeconomic objects. The close connection to database management systems supports socioeconomic applications that are characterized by a large amount of attribute information - for example hundreds of census or survey variables - that is tied to a fixed number of spatial features such as census districts, villages, or survey clusters. Finally, printed output from vector GIS databases resembles more closely maps produced using traditional cartographic techniques.
Even so, the capability to handle raster data is of increasing importance in demographic applications. Some of the input data that are useful for delineating enumeration are boundaries some in raster form. Fortunately, the choice between data models usually does not have to be either-or’. Many GIS software now support both types of spatial data. This, for example allows the use of raster data as a background onto which line and polygon features can be drawn. Thus, remotely sensed images or elevation surfaces can be displayed on a computer screen together with other relevant information to aid the delineation of enumeration areas.
Recently there have been significant advancement in the integration of data formats.(Mckeown 1987; Nellis et al. 1990; Concese et al. 1992; Van der Laan 1992) This has spawned a number of systems that allow conversions between raster and vector data models. e.g. ERDAS Imagine, Arc/Info version 6.0 and higher, Grass, MILGIS. (Evers et al. 1991; Mattikalli 1995) It could be argued that the choice between which data model should be used is futile because the majority of systems will allow easy conversion. Furthermore with memory of computers doubling every eighteen months, mass storage is not an issue of price nor availability and improvements in parallel processing has improved computation time. Indeed Evers at al. (1991) argue:
"…that the need to pose this question (which data model to use) no longer exists since technological changes have made it possible to use both a raster and vector model at the same time" p.314
However it is far from this simple. The processes of vectorisation and rasterisation have distinct limitations. Processes of vectorisation such as line following and polygon capturing require sophisticated hardware, software and algorithms, and intensive manual labor may be required to restructure the resulting data. Data conversion from vector to raster format was much more efficient then from raster to vector (Johnson et al. 1988). This was because line smoothing process that must be performed on vector data derived from rasterised files was time consuming and inefficient. These problems may annul the advantages gained through choice of the most appropriate data model. Furthermore there are questions of accuracy. For example Mattakalli (1995) highlighted problems with processing boundary pixels in polygon capturing because of the interpolation involved in the data conversion procedures. Many of the algorithms used to convert the data are not available in the GIS under the guise of industrial secrecy and consequently the limitations are not known. Choice of which conversion method to use is therefore precarious. (Worboys 1998; Mattakalli 1995)
The choice of which data model to use is heavily reliant upon the application and in turn the application will depend upon the user of the GIS, be they low-end (web based GIS offering a simple service) or high-end users who intend to use the GIS for analytical purposes. Evers and Scholten (1991) comment:
"The nature of separate and varying user views or needs of the same database accompanies a series of sometimes conflicting demands to a GIS" (p.314)
It is critical to encode geographic data so that the user requirements are met. This may often mean, in the case of low end users, providing a clear and concise view of the information that can be accessed quickly. Web based GIS’s are a prime example. It follows that choice of data model, which essentially underpins the view, is vital.
TIN data model fall with in vector data model with the specialty of dealing with 3D features. TIN data model can be a good choice for
v Quantitative analysis of the spatial conditions by measures and numbers
v Volume oriented measure of building density and its distribution within a quarter (3D urban plan for density).
v Spatial analysis of public space and of open spaces between buildings
v Spatial analysis of greenery, its relation to buildings and ecological significance
v Analysis of form and shape of the cityscape by decomposition of details
v Analysis of lighting and shadows as qualitative aspects of an urban setting
v Thematic aspects such as the spatial distribution of particular functions
v Repercussions and effects of different planning stages in their chronological order
v Comparison of alternative plans
9.4 Guidelines to Select Suitable Data Model
v For smooth change of data over space like air or water pollution applications, salinity or any chemical component analysis applications raster data model is best as it can store smooth change of any attribute on the surface.
v Application like simulation modeling where user wants to know the change of final result due to change in input, raster data model is best considering the data processing speed.
v If the data for GIS application is satellite image or any other raster format then choice of raster data model can save time and money both.
v In case of resolution where the locational accuracy is very important vector data model will produce good result.
v When GIS need more or complex relation with database, vector data model is more applicable.
v For the modeling of land surface vector based DEM is best.
v If the GIS system have less data storage capacity (limited space in storage device as the study area is comparatively large), vector data model will be the best.
v Where large area contains a single attribute then vector is best as one polygon can take the attribute and can represent the boundary more accurately.
v To represent linear feature vector is the best, raster cannot give length of a linear feature with acceptable accuracy
v Representation of point require at list one pixel in raster data model but vector can store point more efficiently as in vector data model point has no area.
v When overlapping service area (region) is required like service area of a shopping center may overlap with other, vector data model is the best
v Presentation and analysis of urban 3D features vector (TIN) model is the best
v For linear network or route analysis vector data model is best
Once a data model has been defined, it should be evaluated. The following are a number of criteria according to which any model might be evaluated:
(1) Is it complete? That is, can all the entities that wanted to be represented, and their inter-relationships, be modeled?
(2) Is it robust? Is the model likely to be able to accommodate special circumstances or unusual cases?
(3) Is it versatile? How wide a range of functions can be provided to operate on data that is modeled in this way?
(4) Will its use be efficient? Will data represented according to this model be reasonably economical in its use of storage? Can data be retrieved and/or functions be performed efficiently?
(5) Can data be converted easily from the form in which it is available to the form required by this data model?
9.6 MATRIX TO SELECT SUITABLE DATA MODEL
Table 9.2: Matrix to Select Suitable Data Model
|
Type of application |
Suitable data model |
Rational |
|
Linear service network analysis |
Vector |
Vector can model and calculate distance of linear feature |
|
Service region of point features like shops |
Vector |
Vector can store region topology |
|
High quality cartographic map |
Vector |
Vector polygon and arc can produce cartographic more accurately |
|
Land use map preparation |
Vector |
Polygon with same id will be a class and a polygon can store large area |
|
Soil salinity monitoring |
Raster |
Gradual smooth change of salinity can be stored |
|
Pollution mapping or modeling |
Raster |
Small change of pollutant intensity can be modeled |
|
Modeling land elevation or topography |
Raster |
Every cell will contain the elevation of that smallest area |
|
Flood water analysis |
Raster |
The depth of rain water can be easily stored by raster cells |
|
3D visualization |
Vector (TIN) |
Z axis can be stored and presented by vector based TIN model |
|
3D urban modeling |
Vector (TIN) |
Urban features can be modeled in TIN |
|
Site suitability analysis with overlay and buffering |
Vector |
Required less data storage |
|
Raster |
Faster data processing |