Home Page | My Works | Seminar | BURP Thesis | Contents
CHAPTER SIX
Vector Data Model and Its Application
The vector data model represents geographic features similar to the way maps do. Points represent geographic features too small to be depicted as lines or areas; lines represent geographic features too narrow to depict as areas; and areas represent homogeneous geographic features. An x, y (Cartesian) coordinate system references real-world locations.
In a vector data model, each location is recorded as a single x, y coordinate. Points are recorded as a single coordinate. Lines are recorded as a series of ordered x, y coordinates. Areas are recorded as a series of x, y coordinates defining line segments that enclose an area, hence the term polygon, meaning ‘many-sided figure’. (ESRI, 1998)
6.2 Structure of Vector Data Model
Geometry
The vector data model consists of three types of geometric objects: point, line, and area. A point may represent a gravel pit, a line may represent a stream, and an area may represent a vegetated area. The fourth type of spatial data, continuous 3D surfaces, is usually represented as raster data, although they are often represented by contour lines.
A point has 0 dimension. A point feature occupies a location and is separate from other features. A line is one-dimensional and has the property of length. A line feature is made of points: a beginning point, an end point, and a series of points marking the shape of the line, which may be a smooth curve or a connection of straight-line segments. Smooth curves are typically generated or fitted by mathematical equations, such as cubic polynomial equations. Straight-line segments may represent human-made features or approximations of curves in data entry. Points that mark the shape of a line feature but are not nodes are called vertices. Line features may intersect or join with other lines and may form a network.
An area is two-dimensional and has the properties of area and boundary. The boundary of an area feature separates the interior area from the exterior area. Area features may be isolated or connected. An isolated area feature typically has a node serving as both the beginning and end node. Area features may be surrounded by other areas and form holes within them, such as the Indian reservations surrounded by the state of Idaho. Area features may overlap one another and create overlapped areas. For example, the fired areas from previous forest fires may overlap each other.
Vector data representation using point, line, area, and volume is not always straightforward because it may depend on map scale and, occasionally, criteria established by government mapping agencies. A city on a 1:1,000,000-scale map is represented as a point, but the same city is shown as an area on a 1:24,000-scale map.
A stream is shown as a single line near its headwaters but as an area along its lower reaches. In this case, the width of the stream determines how it should be represented on a map. The U.S. Geological Survey (USGS) uses single lines to represent streams less than 40 feet wide on 1:24,000-scale topographic maps and double lines for larger streams. When hydrography becomes a layer in Digital Line Graph (DLG) data, streams in single lines are digitized as lines, and streams in double lines are digitized as areas. Therefore, a stream may appear as a line or an area depending on its width and the criterion used by the government agency. (http://geolibrary.uidaho.edu /courses/geog385/Lectures/1/)
Topology
Topology explicitly defines spatial relationships. The principle in practice is quite simple; spatial relationships are expressed as lists (e.g., a polygon is defined by the list of arcs comprising its border).
Creating and storing topological relationships has a number of advantages. Data is stored efficiently, so large data sets can be processed quickly. Topology facilitates analytical functions, such as modeling flow through the connecting lines in a network, combining adjacent polygons with similar characteristics, identifying adjacent features and overlaying geographic features.
Topology expresses explicitly the spatial relationships between geometric objects. The vector data model in ARC/INFO supports three basic topological concepts:
| Connectivity: Arcs connect to each other at nodes | |
| Area definition: An area is defined by a series of connected arcs | |
| Contiguity: Arcs have directions and left and right polygons |
ArcView Shapefiles
Not all GIS data files are topologically structured. The standard spatial data format used in ArcView is called shapefiles, which are non-topological. Shapefiles define the geometry and attributes of map features in three basic files. The .shp file stores the feature geometry, the .shx file maintains the index of the feature geometry, and the .dbf file stores the attributes of map features. Depending on the application, ArcView may create and use other files. For example, network analysis requires the use of a network index directory.
Although the feature geometry file in ArcView saves a point as a pair of X, Y coordinates, a line as a series of points, and a polygon as a series of lines, no files describe the spatial relationship among geometric objects. For polygons, the shapefile data structure actually violates the simple polygon topology by allowing shapefile polygons to have duplicate arcs and to overlap one another.
Without topology, shapefiles can create problems in some GIS analysis, such as topology-based map overlay and network analysis. Use of shapefiles, however, has two main advantages (1) they display more rapidly on a view than ARC/INFO coverages, and (2) they are not proprietary and can be used directly in other GIS software packages such as MapInfo and GeoMedia.
Shapefiles can be converted to ARC/INFO coverages, and vice versa. The conversion from a shapefile to a coverage requires the building of topological relationships and the removal of duplicate arcs. The conversion from a coverage to a shapefile is simpler. But if a coverage has topological errors—such as lines not joined perfectly—the errors can lead to problems of missing features in the shapefile. (http://geolibrary.uidaho.edu/courses/geog385/Lectures/1/)
The vector topological capabilities of GIS software can be divided in to two groups
1. Stored Topography (Traditional)
Characteristics
· Topology is stored
· Disk space considerations for stored topology are required
· Topology is built when new data are added
· Data may become outdated
· Errors are detected and cleaned prior to analysis
· Knowledge required to maintain dataset
2. Dynamic Topography (Non-traditional)
Characteristics
· Topology is build on-the-fly and not stored
· Disk space considerations for stored topology minimal
· Topology is created during use/analysis
· Data dose not become outdated
· Errors are not necessarily detected prior to analysis
· Fewer skill required to maintain dataset
(Geo Asia pacific August/September 1999: Michelle Legault, GIS Analyst Research Center, University of Science and technology, Clearwater Bay, Kowloon, Hong Kong)
 Connectivity
Connectivity allows identifying a route to the airport or connecting streams to rivers or following a path from the water treatment plant to a house. Here’s how it works.
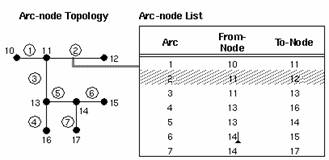
Recall the arc-node data structure. An arc is defined by two endpoints, the from-node indicating where the arc begins and a to-node indicating where it ends. This is called arc-node topology.
Arc-node topology is supported through an arc-node list. The list identifies the from and to nodes for each arc. Connected arcs are determined by searching through the list for common node numbers. In the following example, it is possible to determine that arcs 1, 2, and 3 all intersect because they share node 11. The computer can determine that it is possible to travel along arc 1 and turn onto arc 3 because they share a common node (11), but it’s not possible to turn directly from arc 1 onto arc 5 because they don’t share any common node. (ESRI, 1998)
 Contiguity
Two geographic features, which share a boundary, are called adjacent. Contiguity is the topological concept, which allows the vector data model to determine adjacency.
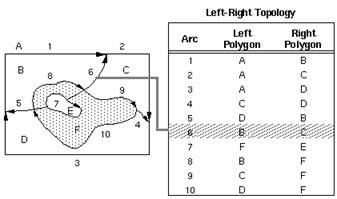
Recall that the from-node and to-node define an arc. This indicates an arc’s direction, so that the polygons on its left and right sides can be determined. Left-right topology refers to the polygons on the left and right sides of an arc. In the illustration below, polygon B is on the left of arc 6, and polygon C is on the right. Thus, it can be known that polygons B and C are adjacent.
Notice that the label for polygon A is outside the boundary of the area. This polygon is called the external or universe polygon, and represents the world outside the study area. The universe polygon ensures that each arc always has a left and right side defined. (ESRI, 1998)
 Area
Definition
Area
Definition
Many of the geographic features wish to represent cover a distinguishable area on the surface of the earth, such as lakes, parcels of land and census tracts. An area is represented in the vector model by one or more boundaries defining a polygon. While this sounds counterintuitive, consider a lake with an island in the middle. The lake actually has two boundaries, that which defines its outer edge and the island, which defines its inner edge. In the terminology of the vector model, an island defines an inner boundary (or hole) of a polygon. Here’s how topology is used to define areas.
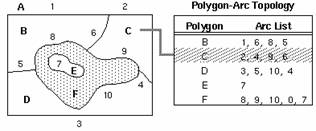
Recall that the arc-node structure represents polygons as an ordered list of arcs rather than a closed loop of x, y coordinates. This is called polygon-arc topology. In the illustration below, polygon F is made up of arcs 8, 9, 10 and 7 (the 0 before the 7 indicates that this arc creates an island in the polygon).
Each arc appears in two polygons (in the illustration below, arc 6 appears in the list for polygons B and C). Since the polygon is simply the list of arcs defining its boundary, arc coordinates are stored only once, thereby reducing the amount of data and ensuring that the boundaries of adjacent polygons don’t overlap. (ESRI, 1998)
 6.3
Special Feature of Vector Data Model
6.3
Special Feature of Vector Data Model
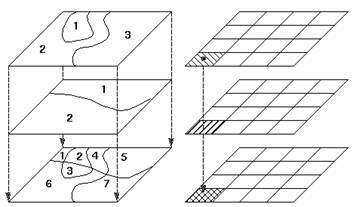
Overlay
The overlay operation examines two datasets to determine what geographic features exist at the same location.
Region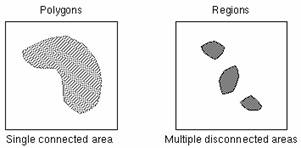
Regions support the modeling of complex relationships between geographic features represented as polygons. Whereas the building block of a polygon is the arc, the building block of a region is the polygon. Therefore, a region is represented as a set of polygons.
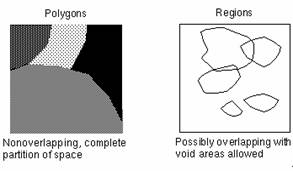 One of the basic
premises of representing geographic objects as polygons is that the polygons
are non-overlapping and completely cover the area being represented. This
constraint is eliminated for regions. In a region, the polygons representing
geographic features can be freestanding, they can overlap and they need not
exhaust the total area. For example, a region of forest fire damage is
represented by polygons indicating the area and time of damage.
One of the basic
premises of representing geographic objects as polygons is that the polygons
are non-overlapping and completely cover the area being represented. This
constraint is eliminated for regions. In a region, the polygons representing
geographic features can be freestanding, they can overlap and they need not
exhaust the total area. For example, a region of forest fire damage is
represented by polygons indicating the area and time of damage.
Another premise of polygons is that each geographic feature is represented by one polygon. This is extended for regions, so that a single geographic feature can be represented by several polygons. For example, the islands comprising the State of Hawaii are a region made up of several polygons.
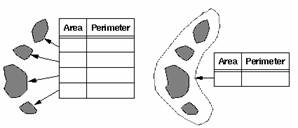 As with points,
lines and polygons, each region is given a unique identifier. As with
polygons, area and perimeter are maintained for each region.
As with points,
lines and polygons, each region is given a unique identifier. As with
polygons, area and perimeter are maintained for each region.
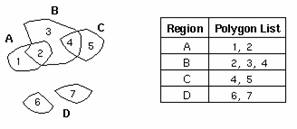
Constructing regions with polygons is similar to constructing polygons from arcs. Whereas a polygon is a list of arcs, a region is simply a list of polygons. One important distinction exists; the order of the polygons is not significant.
Constructing overlapping regions is also similar to constructing polygons. Whereas polygons share an arc where they meet, regions share a polygon where they overlap.
Regions substantially improve data management because they integrate many different kinds of geographic features into a single view while retaining the characteristics of the original geographic features. Managing relationships between geographic features within the data model is particularly valuable when performing complex analysis. (ESRI, 1998)
Network
In general, a network is a system of interconnected linear features through which resources are transported or communication is achieved. The NETWORK data model is an abstract representation of the components and characteristics of real-world network systems. The model consists of network links, network nodes, stops, centers and turns. The key to producing successful network models is in understanding the relationship between the characteristics of physical network systems and the representation of those characteristics by the elements of the network model.
Network provides tools to find paths - the shortest or minimum impedance path through a network. Included also is tours - a heuristic procedure to what is commonly called the traveling salesman problem, finding the most efficient path to a series of locations. Allocation functions assign portions of the network to a resource supply location. Location-allocation determines site locations and assigns demand to sites. (ESRI, 1998)
6.4 Applications of Vector Data Model
A Case Study of Vector Data Model: Site selection for cinema in Khulna City as a recreational facility for low income people
A city may be blessed with large number of industries, residential neighborhoods, business-establishments, shopping facilities, and so on. But it falls short of its highest possibilities if it does not have those qualities of living that represent a more fruitful and happy life for its people. Recreation is one of those qualities of a city that make living happier. There is nothing in the city plan that may contribute more vitally to this richer life of the people than appropriate provision for recreation (Mahamud, 1999).
In the society recreational opportunities for the people of all ages and all groups are urgently needed. People have only very recently and to a very limited extent have begun to understand recreational needs in a scientific way. Planning is required to provide recreational facilities in proper way and in proper location.
In general the low income group of the society becomes more deprived from recreational facility as they cannot afford many available recreational facilities. In Khulna City public recreational facilities are very much limited. Even there is a real shortage of developed public open space or park in Khulna City. In this situation cinema can be a cheap recreational facility for the low income group of this city. In this study the service area of the existing cinema of Khulna has been delineated out and the site for cinema in the unserved area has been found out through some criteria. This study shows the practical application of vector data model capabilities.
Location of cinema is an important issue considering its service user. If a cinema are located in an odd place, people will not go there and the resource spend for it will remain unused. In case of Khulna city there is a cluster of cinema near CBD. Beside BIDC road near Khalishpur there are two cinemas within 100 m distance. So people at some place have more choice to watch movie at cinema as there is more than one cinema at reasonable distance. From the location of cinema of Khulna City (Map 6.1) it seems that there may be some places from where the distance of nearest cinema will be significantly high.

6.4.2 Criteria for site selection
Site selection or suitable location analysis is a very common application of GIS. But most of the cases application of overlay and buffer is popular. In this study at first the unserved area has been found out through network allocation analysis and then the other GIS analysis techniques are applied along with overlay and buffer.
1. The area must be outside the service area of existing cinema
2. The site has to be within agricultural, commercial or mixed use area that is outside residential area
3. The area has to lie within low and middle income group’s residence
4. The area has to be within 20 m to road
5. The area has to be more than 2 acre plot
Allocated area calculation
Cinema is a media of recreation to the poor and middle class people as they cannot afford other expensive recreation at home. The demand for cinema has been calculated from both secondary data and field survey. The locations from where the sample has taken are shown in Map 6.1.
Table 6.1: Demand for cinema in Khulna City
|
Age group |
Frequency |
Percent |
|
0-18 |
36 |
18 |
|
19-45 |
82 |
41 |
|
46-60+ |
22 |
11 |
|
Total |
140 |
70 |
|
Total respondent |
200 |
100 |
|
Do not go to cinema |
70 |
30 |
Source: Field Survey 2001
Table 6.1 shows that demand for cinema mainly consist of 19-45 year age people and the people beyond the range are less interested. From the field survey it is found that 30 percent people not interested to go to cinema.
Demand calculation for network coverage
To calculate demand of network age group wise percentage has been applied. Ward wise population and percent of people at the age groups were taken from secondary source. Based on this two data ward wise population of the age groups has been calculated.
From the data of Table 6.1 and the result of the above equation the demand for each ward of each age group has been calculated. The summation demand of age groups of a ward will be the total demand for the ward.
Total demand of a ward has been distributed to the road segment of the ward (road arc was considered as demand element of network coverage). For this distribution the total length of road of each ward has been calculated. Total demand of the ward has multiplied by total length and multiplied by a road arc length to obtain demand of an individual road segment.
Capacity calculation of point coverage
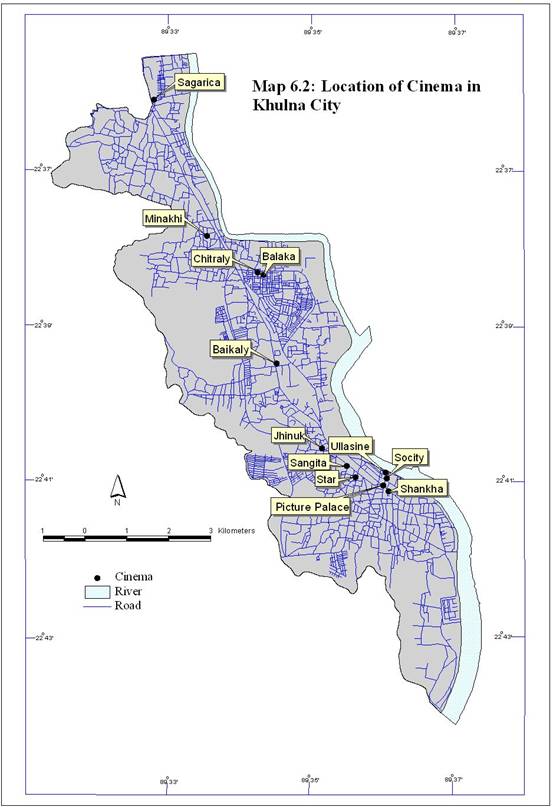
The capacity of cinemas of Khulna city is shown in Table 6.2 and the location of the cinema is presented Map 6.2. In general, the people do not watch more than one movie in a week and they are less interested to watch movie at night show (9PM to 12AM). The number of movie watcher of this show at cinema is very low. So for capacity calculation it has taken that a movie watcher will watch movie at three shows and will not repeat within a week.
Table 6.2: Capacity of cinema of Khulna city
|
Name |
Site |
|
Sagarica |
800 |
|
Minakhi |
700 |
|
Chitraly |
500 |
|
Balaka |
600 |
|
Baikaly |
850 |
|
Jhinuk |
600 |
|
Sangita |
800 |
|
Ullasine |
250 |
|
Star |
750 |
|
Socity |
700 |
|
Picture Palace |
700 |
|
Shankha |
1050 |
So the total number of seats of cinema is multiplied by 3 and then 7 that is
Capacity of a cinema = number of site X 3 X 7
Through the equation calculated capacity has stored in polygon attribute table of the point coverage of cinema.
Impedance limit
Survey revels that people do not want to travel more than 3km to go to cinema. So impedance limit has taken 3000 m or 3 km.
Network allocation
Applying a SML (ANNEXURE A) in PC ARC/INFO ‘ALLOCATE’ network analysis has been performed taking before mentioned demand, capacity and impedance limit.
The allocated arc has been identified through map query in ArcView. With the allocate arc a shape file has been created in ArcView. Map 6.3 shows the allocated network. The edge nodes of allocated arc have been connected to prepare allocated area with polygon topology. Allocated area of cinema in Khulna city is shown in Map 6.4.
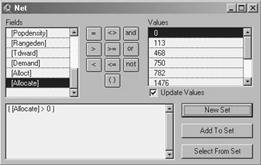
Figure 6.1: Map query to select allocated arc
A field (column) “Allocated” in the shape database table of the allocated area has added and through “field calculator” (similar as calculate in ARC/INFO) all record value of “allocated” field has been set to 1. This value will be the identification of the allocated area.
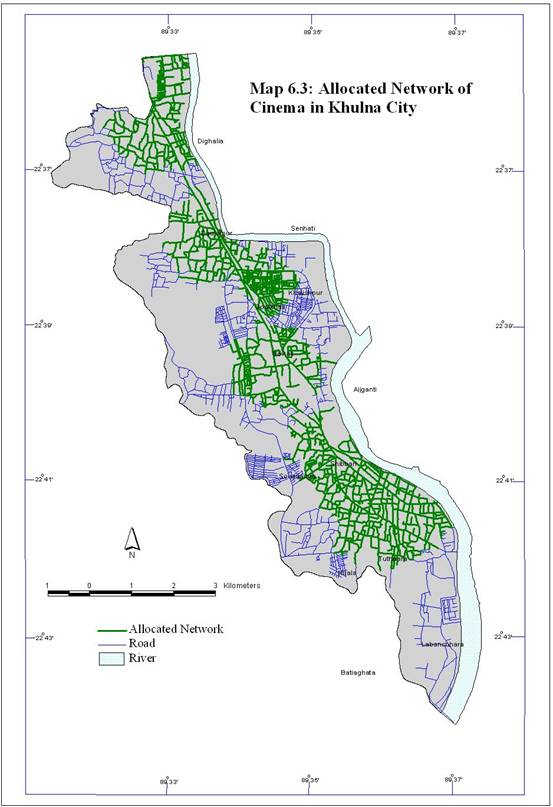
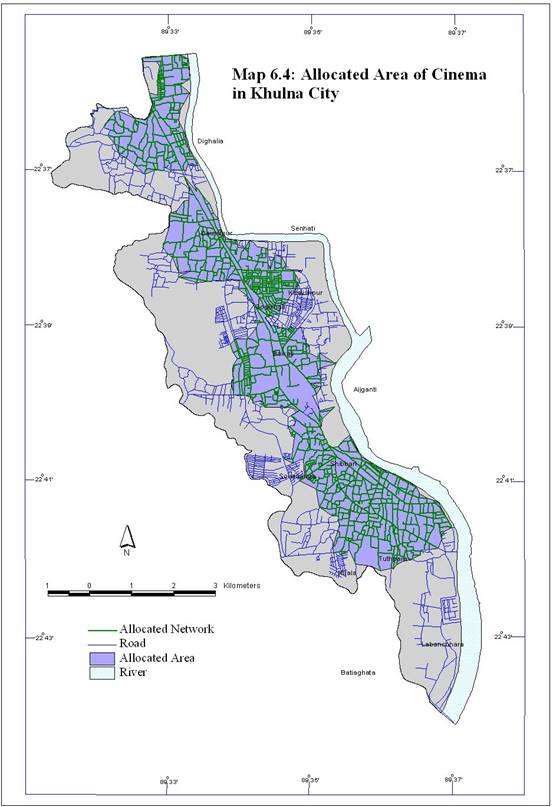
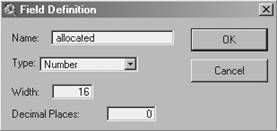
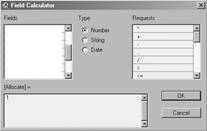
Figure 6.2: Adding field and setting value to shape database table
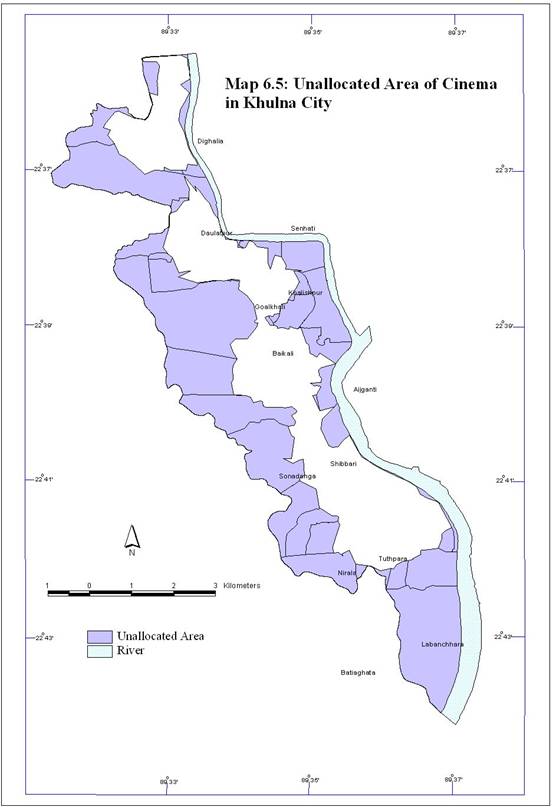
The ward boundary polygon and allocated area polygon has been unioned in ArcView through Geoprocessing Extension. Unallocated area shape file has been created by map query using allocated = 0. Map 6.5 shows the unallocated area in Khulna City.

Figure 6.3: Union of two themes
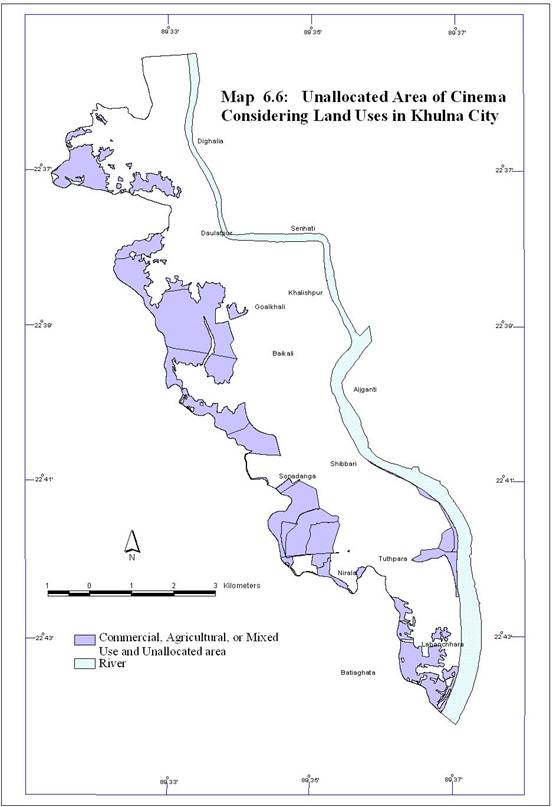
The unallocated area theme has unioned with land use and the area which was unallocated and lie under agricultural, commercial or mixed use area has been separated in the same way mentioned above. Map 6.6 shows the output.
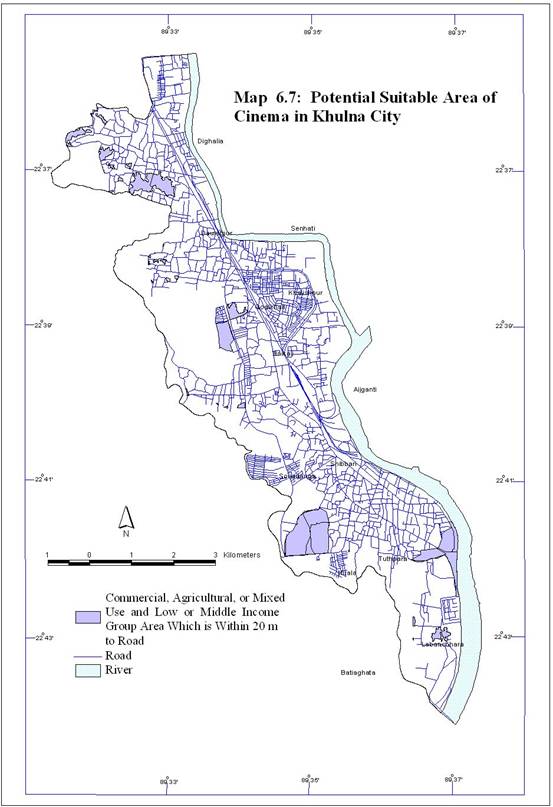
The last theme has been unioned with area of income group. The unallocated area which was in agricultural, commercial or mixed use and lie within the low or middle income group area have been separated also in the same way mentioned above. Through “select by theme” function of ArcView the area within 20 m to road has found out. Map 6.7 shows the output.
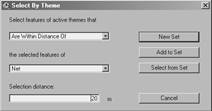
Figure 6.4 Finding areas within distance of 20 m
In the shape database table of the last theme a field “Cal_area” has added and
in field calculator the area of all polygons has been calculated in acre using
an Avenue Script (ANNEXURE B) and area more than two acre has found out
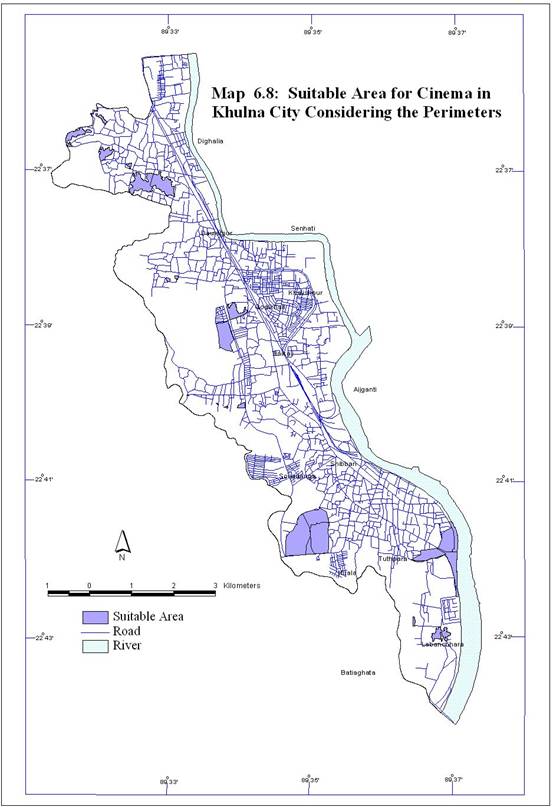
using query. The suitable site for additional cinema is shown in Map 6.8.
There are 21 places in Khulna suitable for additional cinema. The total area of the sites is 578.213 acre
In this study the popular vector capabilities has been used. The location and capacity of each cinema and total population of each ward is collected. With this data the demand for cinema and capacity of cinema has been calculated. With network allocation the allocated area has been calculated. The area outside the allocated area has been treated as unallocated area and with the mentioned criteria the location for additional cinema has been calculated through overlay technique.