Home Page | My Works | Seminar | BURP Thesis | Contents
CHAPTER FOUR
PROSPECT OF GIS APPLICATION IN PLANNING
Geographic Information System (GIS) is a Computer system that records, stores, and analyses information about the features makes up the earth's surface. A GIS can generate two- or three-dimensional images of an area, showing such natural features as hills and rivers with artificial features such as roads and power lines. Scientists use GIS images as models, making precise measurements, gathering data, and testing ideas with the help of the computer (Encarta, 2001).
Geographic Information System (GIS) is defined as an information system that is used to input, store, retrieve, manipulate, analyze and output geographically referenced data or geospatial data, in order to support decision making for planning and management of land use, natural resources, environment, transportation, urban facilities, and other administrative records (Shunji, 1999).
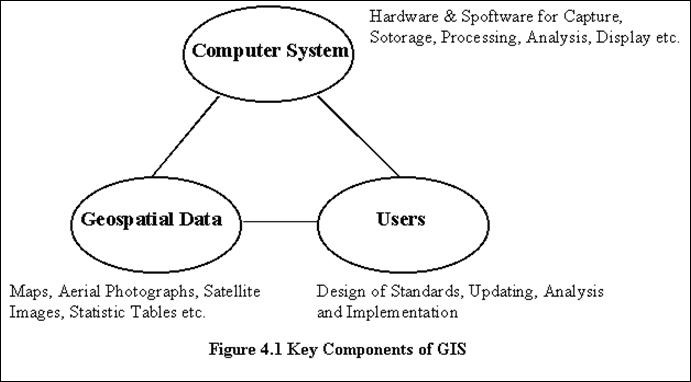
The key components of GIS are a computer system, geospatial data and users, as shown in Figure 4.1.
4.2 Short History of GIS Software
GIS software in 1979
v A historical GIS "snapshot" was the IGC survey conducted in 1979
v In the 1979 survey, most GISs were sets of loosely linked FORTRAN programs performing spatial operations
v Computer mapping programs had evolved GIS functionality
GIS in the 1980s
v Spreadsheet was ported to the microcomputer, allowing "active" data
v Relational DBMS evolved as the leading means for database management
v Single integrated user interface
v Degree of device independence
v Led to the first true GIS software
Second generation of GIS software
v Used graphical user interfaces and the desktop/WIMP model
v Unix workstations integrated GIS with the X-windows GUI
v GISs began to use the OS GUI instead of their own
v PCs integrated GIS with the variants of Windows and other OSs
4.3 The "critical six" functional capabilities
- data capture
- storage
- management
- retreival
- analysis
- display
a. Data capture functions
| digitizing | |
| scanning | |
| mosaicing | |
| editing | |
| generalization | |
| topological cleaning |
b. Storage functions
| compression | |
| metadata handling | |
| control via macros or languages | |
| format support |
c. Data management functions
| physical model support | |
| DBMS | |
| address matching | |
| masking | |
| cookie cutting |
d. Data retrieval functions
| locating | |
| selecting by attributes | |
| buffering | |
| map overlay | |
| map algebra |
e. Data analysis functions
| interpolation | |
| optimal path selection | |
| geometric tests | |
| slope calculation |
f. Data display functions
| desktop mapping | |
| interactive modification of cartographic elements | |
| graphic file export |
4.4 Integration of GIS with Other Field
GIS itself is a powerful technology, moreover it can be integrated with remote sensing and modern survey equipment like GPS (Global Positioning System), TS (Total Station), Echo Sounder to observe the earth and its change in time to use available resource properly.
4.4.1 Integration with Remote Sensing
Remote Sensing is the science and technology by which the characteristics of objects of interest can be identified, measured or analyzed without direct contact.
The characteristics of an object can be determined using reflected or emitted electro-magnetic radiation from the object. That is, “each object has unique and different characteristics of reflection or emission if the type of the environmental condition is different”. Remote sensing is a technology to identify and understand the object or the environmental condition through the uniqueness of the reflection or emission.
Remote sensing identifies the object on the earth then GIS can take its output to produce map and store spatial data for analysis. Data collection through survey is a time consuming and costly process. Satellite image and remote sensing can reduce the required time and money both. As GIS have the capability to take remote sensing data as input it become cheap and it can also reduce the manual processing error.
For decades the U.S. and the former Soviet Union have used high-resolution satellite imagery for military purposes. Only recently, however, has the civilian community in the U.S. been given permission to launch satellites that can resolve objects on the ground as little as a meter apart. Existing civilian satellites can obtain a 10-m (33-ft) ground resolution, and data from those satellites already have had an enormous impact on mapping, allowing the creation of specialized maps that can be used, for example, to predict crop yields, model optimal lumber harvests, or chart ever changing wetlands. With the higher resolution imagery expected to be available in 1995, along with GPS-controlled satellite positioning, mapmaking is certain to redraw its conceptual borders even more (John, 2000).
4.4.2 Integration with Modern Survey Equipments
The use of chain survey, plane table survey and such manual survey methods and equipments are replaced by modern digital survey equipments like GPS (Global Positioning System), TS (Total Station), Echo Sounder etc. Digital survey equipment can give output directly to computer. GIS can take this data and relate with land space. So the survey data need not to be manually processed to build relation with space.
Complementing GIS is GPS, a technology funded by the U.S. Department of Defense. Conceived for such applications as warship and aircraft navigation and missile guidance, GPS has become the foundation of modern mapmaking. GPS consists of a fleet of 24 satellites that transmit signals globally around the clock. In conjunction with receivers on Earth, GPS can quickly and accurately determine the latitude, longitude, and altitude of a point on or above the Earth's surface. A single GPS receiver costing as little as $250 can find its own position in seconds from GPS satellite signals with an accuracy of 50 m (165 ft). Accuracies of less than 10 cm (4 in) are possible if two (more expensive) receivers are used together. This capability has reduced the cost of acquiring the spatial data needed for making maps while increasing cartographic accuracy (John, 2000).
All these techniques are integrated in practical work to save time and money. To prepare map or the current condition of a place for different project high resolution satellite image of the study area is collected. With the help of GPS the image is registered with the study area to know the exact location of a point in image and real world. After image processing many attribute data can be acquired from the image. Satellite image of different time can produce a trend of change of an attribute or compare an attribute in temporal dimension.
GPS and TS are used to survey land elevation of an area. The latitude and longitude and altitude of some points are taken from a GPS. Then with those point the instrument location and height of TS is calculated or it is directly taken by GPS. With TS the other points on the study area are recorded in disk of TS. The recorded field data downloaded to a computer which contain x, y, z value of different points of the study area. The data then interpolated to generate land elevation, contour or Surface DEM.
River bathymetry or the river bed survey is also possible very accurately now with simultaneous reading of an echo sounder and a GPS from a boat. The echo sounder will calculate the deft of the river of a point and GPS will calculate the latitude longitude of that point. In this way many point data area collected then with GIS the points data is interpolated to produce river bed map or river bathymetry in DEM or TIN format.
Some GPS can produce digital map directly and give output to GIS. The GPS can take data to produce arc, polygon and point with little annotation like the starting and ending point name of an arc or a point. When the data of the GPS is downloaded to computer then the data can be projected by the software provided with the GPS and produce ARC/INFO coverage or ArcView Shape file or DXF format file which contain some annotation provided during survey.
4.5 Use and Prospect of GIS in Planning
In developed countries most management-oriented information such as school enrolment, deaths, births and marriage records, real estate transactions, license etc. are installed in the computer systems (Harris, 1989).
A GIS serves as a database and organising tool for planning database and a tool box for urban planning. As a database, spatial and textual data can be linked by a geo-relational model for data query and retrieval (Huxhold, 1991). This information can then be presented as a series of thematic maps showing the locations of different features and activities, or something about the attributes of those activities. The ability of GIS to present geographical data on thematic maps has turned it into an essential tool for planners by assigning them in visualizing, integrating, manipulating and analysing information on various urban planning and policy-making activities (Kam, 1993).
The full spectrum of a planner’s activities includes negotiation bargaining, giving explanations of decisions and proposals about planning rules, recommending permission for development, and above all planning the future to reduce problems (Harris, 1989). All these applications involve large volume of geographical data. In developing countries, such information is mainly collected by field survey and stored on traditional hard-written documents, making subsequent retrieval very difficult. Any inquiry into urban information-base takes weeks, months or even years rather than minutes or hours, making the day to day planning task and activities of planners difficult. This problem can readily be overcome by the geographic database integration and organizing capabilities of GIS. The major advantage of GIS when compared with traditional and non-computerised database management procedure is the remarkable speed with which GIS are able to search through large volume of data and generate output that matches user-specified criteria.
With a GIS, planner can also query the urban database based on certain criteria and display the results on a map, where they can then study the spatial distribution of data records or attributes. A GIS also facilitates spatial queries. In a spatial query, a planner relies on the map as a querying tool, not just as a database presentation device (Landis, 1993). Typically, in a spatial query, the user will access database by pointing to a specific area of a map display. The GIS will then search the database to find those records that fall within the query window, and present the results of the search in a tabular format.
Physical planning is very much concerned with the spatial structure and organization of a geographical region. Plans are produced in order to resolve existing spatial problems and to establish a development direction for the future. The purpose of these plans is to (re)structure the spatial allocation of factors, like housing, employment, community services (e.g. hospitals and schools), tourist services, shopping centers, and public transport that determine the prosperity and well-being of a locality. Most of these factors are inter-related and locational change in one affects the others (Schuur and Erkel, 1991). A GIS can answer what will happen if any one changes.
As a tool-box, a GIS allows planners to perform spatial analysis by using its whole range of geo-processing or cartographic modeling functions – map overlay, buffering point-in-polygoning, distance and proximity analysis and network analysis (Berry, 1987, Tomlin 1990, Aronoff 1989, Landis 1993).